A.3 Context 2: Total Force on a Water Tower's Walls
On this screen we will start to compute the total outward force that the water inside a water tower exerts on the container's walls. This will involve a bit of Physics (that we'll explain) and then developing (you guessed it) Sums we can use to calculate overestimates and underestimates of the total force. This scenario represents another common use of setting up an integral that we're using to help you understand what an integral is.
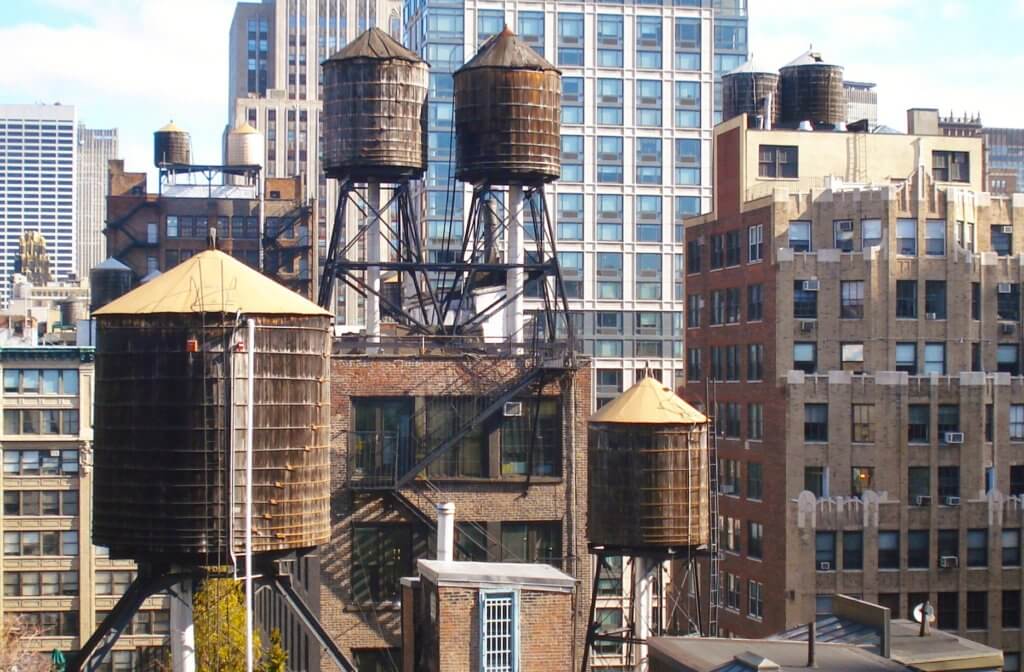
The water towers that dot the New York City skyline have received attention for various reasons, including:
- the story behind the builders;
- the potential neglect of older towers;
- Neil deGrasse Tyson's extreme interest in the engineering behind water towers.
In particular, let's consider a water tower that has 5-foot radius and 15-foot height, and is filled to the top with water.
Your goal is to find an approximation, good to within a 500-pound error,
for the total outward force that the water exerts on the tower's walls.
Information you need for this scenario
Pressure and Force relationship:

Pressure is defined as force per unit area. If the force is constant (uniform) across a surface of area A, then the resulting force on that surface is
Surface area of a cylinder:

The surface area A of a cylindrical ring of radius r and height h is
FAQ: "Don't we have to include the surface area of the bottom of the cylinder?"Answer: We don't, because our task is to find the outward force on the walls of the tower. We're not concerned with the force on the bottom surface.
Pressure due to water as depth varies:

At water depth d, the weight of the water above causes the pressure at that depth. Hence the deeper you go, the greater the pressure due to the greater weight of the water above pushing down. The water's pressure is in direct proportion to the depth d beneath the water's surface, according to
The interactive graph below shows you the pressure due to the water as a function of depth below the water's surface.
This pressure at a given depth acts in all directions: upward, downward, and most importantly for us here, outward, pushing against the tower's walls.
Quick Question: Metal bands around water towers

Quick Question: What's the reason steel bands encircle a water tower? Why are the bands closer together near the bottom of the tank than near the top?
Part I: 5-term approximation
Recall that our goal is to find the total outward force that the water exerts on the tower's wall, to within an error of 500 lbs. Let's again use our Approximation Questions to frame our work:
Questions for Approximations
1. What are you approximating? Why can't you find the exact value immediately?
2. How will you generate an overestimate for the value we're after? An underestimate?
Since this is our first time dealing with a slightly complex scenario, we're going to step you through the process here. The key move is the same as before: we're going to replace the entirely of the wall's surface (the entire interval of interest) with a set of subintervals.
Specifically, as a first calculation we're going to imagine breaking the tower's cylinder into a set of 5 vertically stacked rings as shown, thus giving us 5 subintervals to work with. We could have chosen more or fewer; 5 is just a convenient number since the tower is 15-feet tall, and so each of the five rings is 3 feet tall.

With this picture in mind, we can develop the same two steps as on the preceding screen to generate our overestimate and underestimate for the total force on the tower's walls:
- Determine the approximate total outward force on each individual ring,
𝐹 𝑖 𝐹 𝑖 = ( r e p r e s e n t a t i v e p r e s s u r e o n r i n g \ # 𝑖 ' s w a l l ) ⋅ ( s u r f a c e a r e a o f r i n g \ # 𝑖 ) = 𝑃 𝑖 ⋅ 𝐴 𝑖 - Sum the force on all of the rings:
𝐹 t o t a l o n w a l l s = 𝐹 1 + 𝐹 2 + 𝐹 3 + 𝐹 4 + 𝐹 5 = 𝑃 1 ⋅ 𝐴 1 + 𝑃 2 ⋅ 𝐴 2 + 𝑃 3 ⋅ 𝐴 3 + 𝑃 4 ⋅ 𝐴 4 + 𝑃 5 ⋅ 𝐴 5

In order to rewrite the areas
FAQ: "You factored out the
Answer: Those are great questions. The honest answer is that we're building up a new tool here, and we won't see fully how it works until further down on this screen. For now, know that in order to improve our approximation later we need a series of terms that we're summing, and each term must be the product of (1) a representative value
Now that we have an expression for the 5-term approximation of the total force, let's work to develop both an overestimate and underestimate. We'll start with the overestimate.
Overestimate
Let's begin with Step 1 above, and write an expression for an overestimate of the force on just one subinterval. We again arbitrarily choose to focus on Strip #2.
We have an initial choice to make: what pressure do we use as our single constant, representative pressure across the entire surface of Strip 2? Since the pressure changes linearly from the top to the bottom of the strip, we know our choice will be either the pressure at the top or at the bottom (as opposed to somewhere in between).
Check Question 1: Pressure choice for overestimate
We're currently developing the overestimate for the force on Strip 2. The single value we want to use as the uniform pressure across Strip 2's entire surface is therefore:
(Tap on the correct choice on the image below, either
With that correct choice we now have the overestimate for the force on Strip 2:

We can then apply the same reasoning to write the overestimate for the force on each of the strips, and then sum those to find the total overestimated force. Since we're using the pressure at the bottom of each strip for our overestimate, we have
Check Question 2: Graphical Representation of the overestimate
Below is a graphical representation of the 5-term overestimate sum between the brackets [...] above (leaving out the factor of
Tap the rectangle that represents the term
As Check Question 2 highlights, since pressure is an increasing function of depth, for our overestimate here we computed a right sum,
Let's pause to highlight that we now know the actual force on the tower's walls is less than our overestimate:
Underestimate
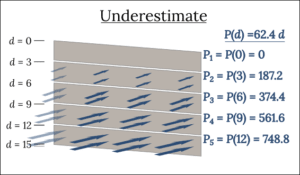
Let's turn now to compute the underestimate of the total force on the tower's walls. The calculation is the same as above, except now for the representative pressure on each strip we use the pressure at its top rather than at the bottom.
Even our underestimate is a lot of force on those tower walls.
Check Question 3: Graphical representation of underestimate
Below is a graphical representation of the 5-term overestimate sum between the brackets [...] above (again leaving out the factor of
Tap the rectangle that represents the term
Check Question 3 highlights that our underestimate is a left sum,
Summarizing our work so far, from our 5-term sums we know
Part II: Focus on the error bounds
Recall the third Question for Approximation:
3. The difference between your current overestimate and underestimate values is your "error bound." What is its current value?
Before we work to improve our approximations, let's consider a way to visualize the error bounds graphically.
Thinking Question: Visual representation of the error bound
Which graph below depicts regions that represent the error bound for each subinterval? (More than one answer is correct; choose the one you prefer.)

Let's consider now our fourth and final Approximation Question:
4. How can the error bound be made smaller than any predetermined value?
You probably already have the answer in mind: we'll increase the number of terms, n, in our two sums. Before we do that, let's develop the sigma notation we need to represent these sums — much better than actually writing out more and more . . . and more . . . terms by hand.
Activity: Develop sigma notation for the overestimate
Drag the appropriate dark-shaded pieces below up to the blank rectangles to represent correctly the sum for the overestimate. Recall that since we're using
Activity: Develop sigma notation for the underestimate
Drag the appropriate dark-shaded pieces below up to the blank rectangles to represent correctly the sum for the underestimate. Recall that since we're using
Increasing n
Now that we've developed the sigma notation, let's put it to use. The graphs immediately below show the rectangles that represent the overestimate (on the left) and the underestimate (on the right) approximations. Initially there are
Below that you'll see a graph that represents the error bounds as we developed them in Choice D in the Question immediately above.
Please familiarize yourself with how these sums and graphs work; we'll continue with a question below.
Whichever view you use, notice that as you increase n, the small rectangles that represent the error become smaller and smaller. That's of course the point of increasing the number of terms: to decrease the size of the error on each subinterval. Make sure you zoom in on the error-bound graph so you can still view some of the rectangles clearly and thereby see how they're becoming smaller because the overestimate and underestimate for each subinterval become closer and closer to each other. We are essentially squeezing the true value between these two estimates.
Now, time to address the goal of this entire screen, which we can do readily using the calculations we've set up above. Note in particular that the equation immediately above shows the error bound for the current value of n, and so you can determine the minimum value of n necessary to produce the desired error bound of 500 pounds.
Question: Minimum number of subintervals to meet tolerance goal
Conclusion and Reflection
Rather than our usual "Upshot" here, we're going to ask you to revisit the Approximation Questions and answer them for yourself since they are the basis for our work here. You can reveal our answers if you'd like; some of them repeat what we wrote above.
Questions for Approximations
1. What are you approximating? Why can't you find the exact value immediately?
2. How will you generate an overestimate for the value we're after? An underestimate?
3. What is the difference between your current overestimate and underestimate values is your "error bound." What is its current value?
4. How can the error bound be made smaller than any predetermined value?
We hope you're starting to become more comfortable with how to set up a sum that represents an overestimate, and underestimate, of an accumulation of some quantity; in this case, that quantity happens to be the total force on a water tower's walls. On the next screen we'll examine one more scenario where we need to accumulate something that has a varying rate-of-change, this time focusing on an object's motion.
For now, what are your thoughts about the material on this screen? What questions do you have, or suggestions for improvement? (We know there's a lot going on here, and would like to make things clearer for future students so we could use your help!) Please head on over to the Forum and let us know.
How helpful was this page?
Our goal is to provide the best content we can, for free to any student looking to learn well, and your feedback helps us improve.